
Part II: The American Dream Casino
To understand how economic inequality is created and exacerbated over time, it is helpful to examine society along a different set of axes:
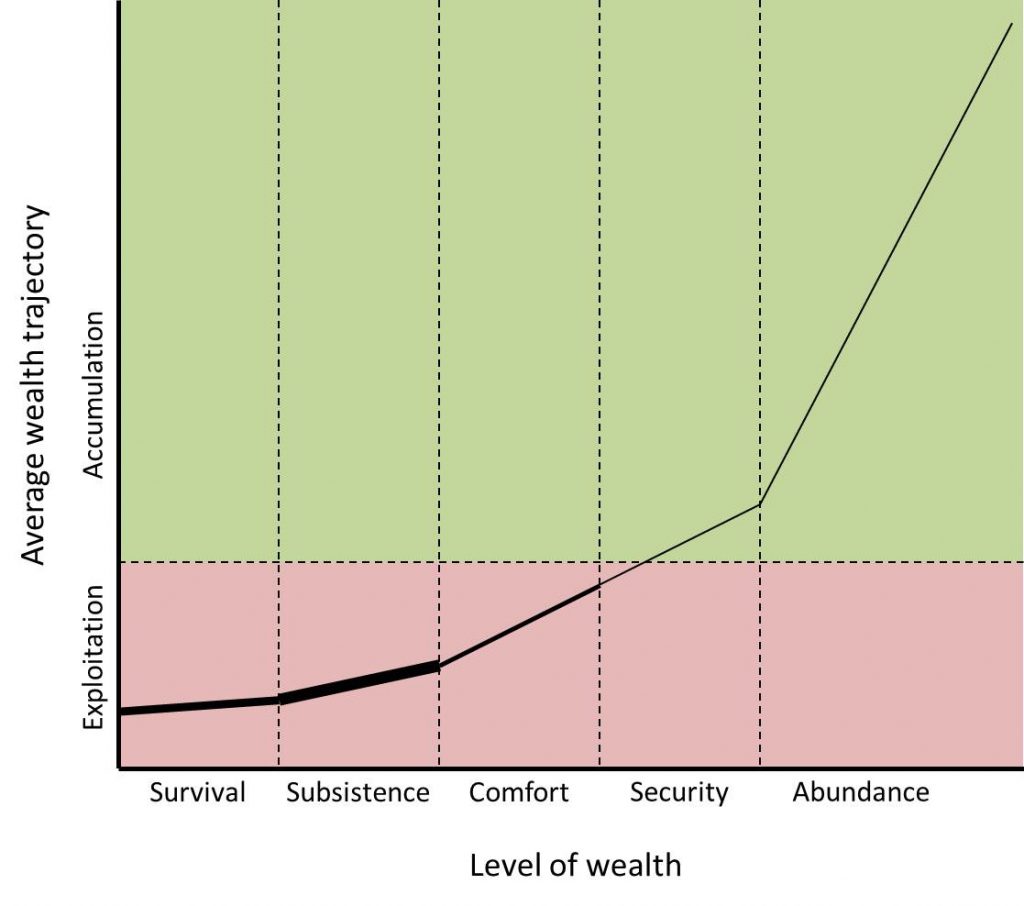
On the horizontal axis we have level of wealth. I’m less concerned with numbers of dollars or pounds of gold here than I am with the ability to provide basic needs, cover emergencies and eventual retirement, or make discretionary purchases. I have divided this into five categories:
- Survival: Some basic needs go unmet due to insufficient resources.
- Subsistence: Basic needs are met but with no cushion to cover emergencies.
- Comfort: Sufficient cushion to cover emergencies, and some retirement savings, but assets may not be sufficient to cover retirement years or a major emergency.
- Security: Sufficient assets to cover retirement or most foreseeable emergencies, but some decisions are still constrained by available wealth.
- Abundance: Money is typically not a concern in making life decisions; all options are on the table.
On the vertical axis we have average wealth trajectory. This is defined as the average change in level of wealth over time across all people in society who share the same position on the horizontal axis. In the green (“accumulation”) zone wealth is increasing, while in the red (“exploitation”) zone wealth is stable or decreasing, and workers are not being paid a fair wage for their labor.
Finally, the thickness of the line is roughly proportional to the number of people in that position.
Let’s start by examining a feudal society, which looks something like this:
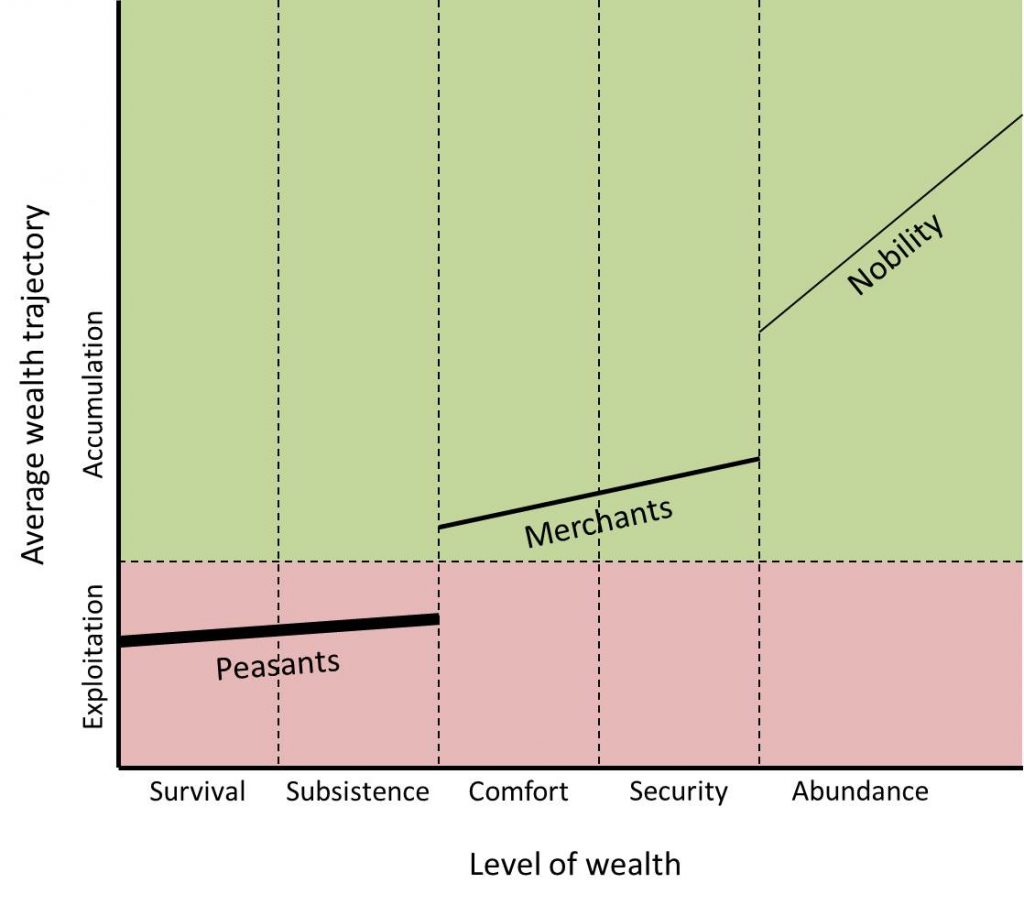
Peasants, the majority of the population, are locked into poverty by heavy taxation and a lack of land ownership, while the upper classes accumulate the extracted wealth to reach – in the case of nobility – a high level of opulence. This is also a caste system, in that peasants have essentially zero opportunity to rise into the merchant or nobility classes, and the higher classes have no risk of falling into the peasantry.
In contrast, the generalized American chart looks like this:
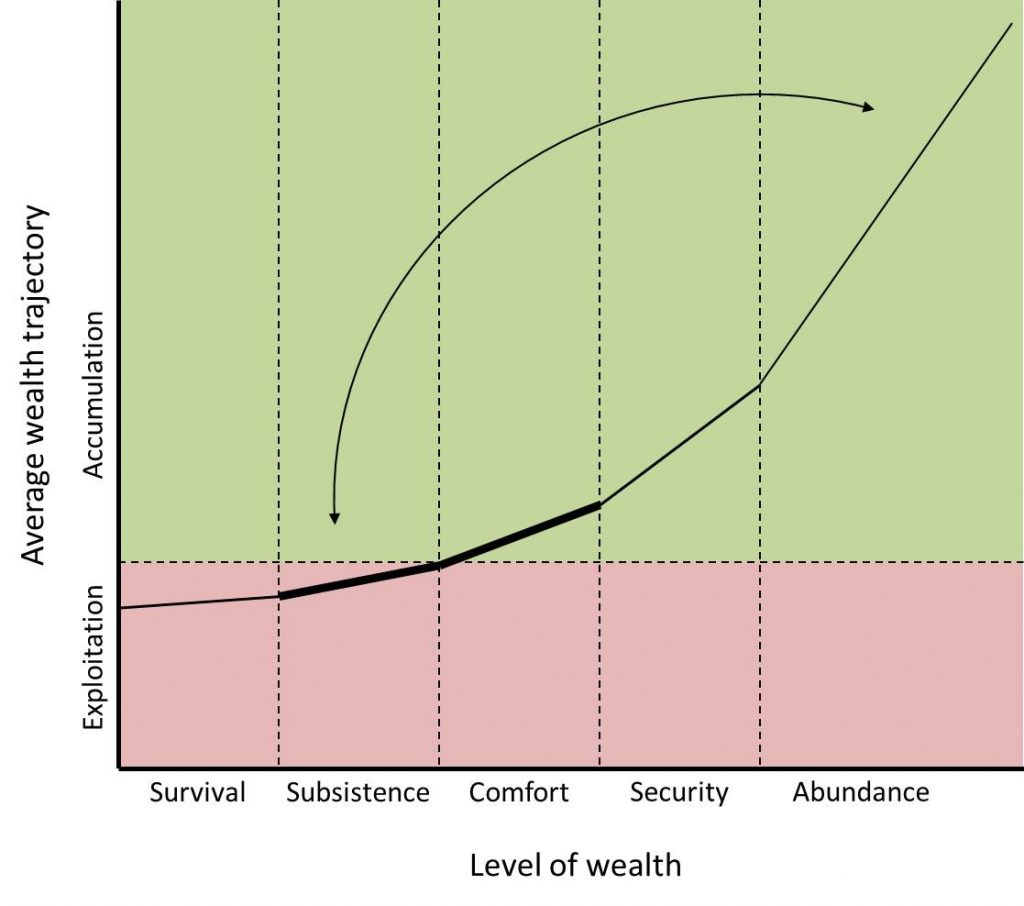
With no rigid castes, people have a nonzero chance of following a rags-to-riches or riches-to-rags trajectory – which makes for good stories – but on the whole the poorest folks remain stuck in poverty and the richest folks get richer. Moreover, the shape of this curve guarantees that wealth inequality will increase over time. Playing the game of life in America is less like a dream and more like a trip to the casino. Winning big is a possibility for anyone, but the deck is stacked; those who play with hundreds usually take home thousands while those who play with quarters are often left with dimes.
To understand our current moment, it is helpful to examine this chart at different moments in history. Early America looked something like this:
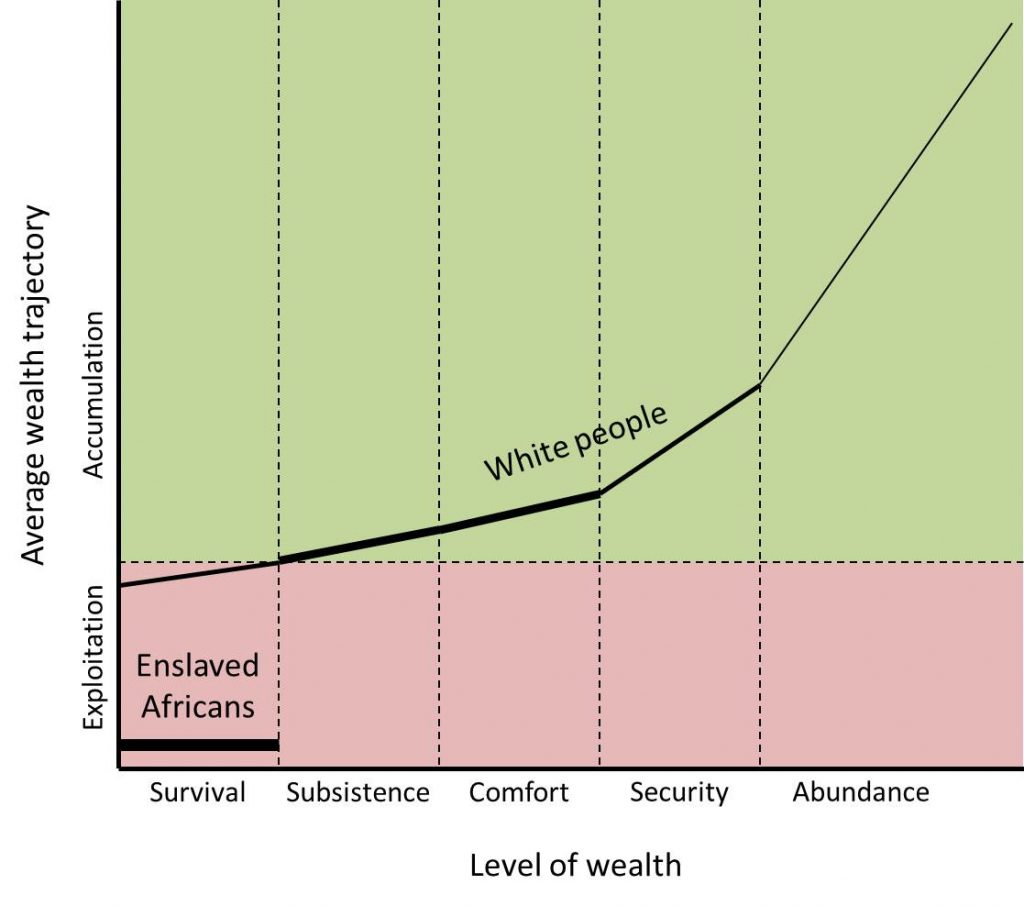
White people mainly stayed out of the red zone – their fortunes increased – thanks to the institution of slavery which exploited the labor of a vast number of people while paying the returns to the upper echelons.
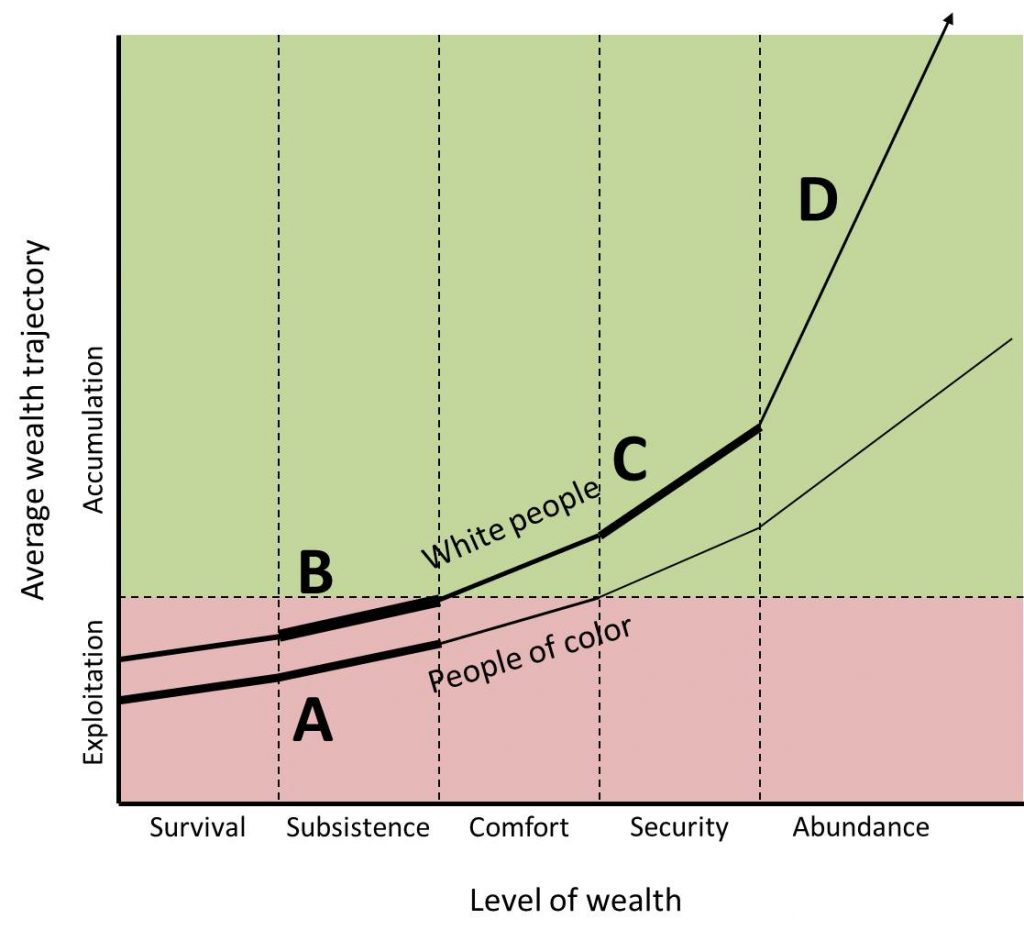
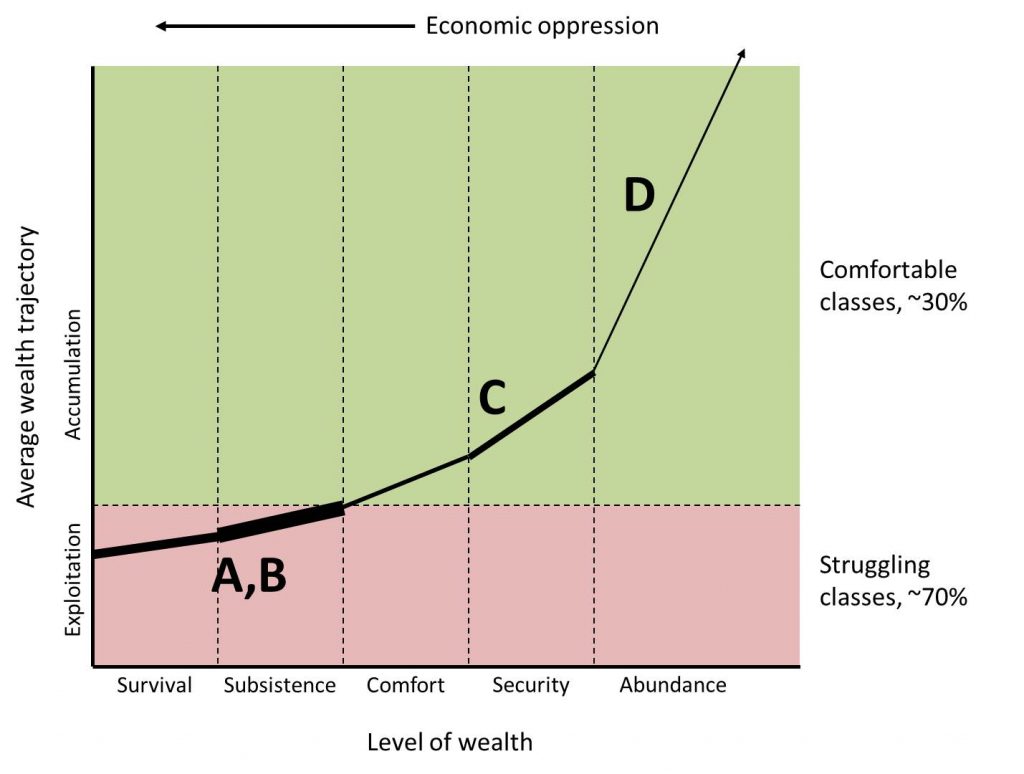
In the decades following World War II – from 1945 through about 1990 – the curve looked more like this:
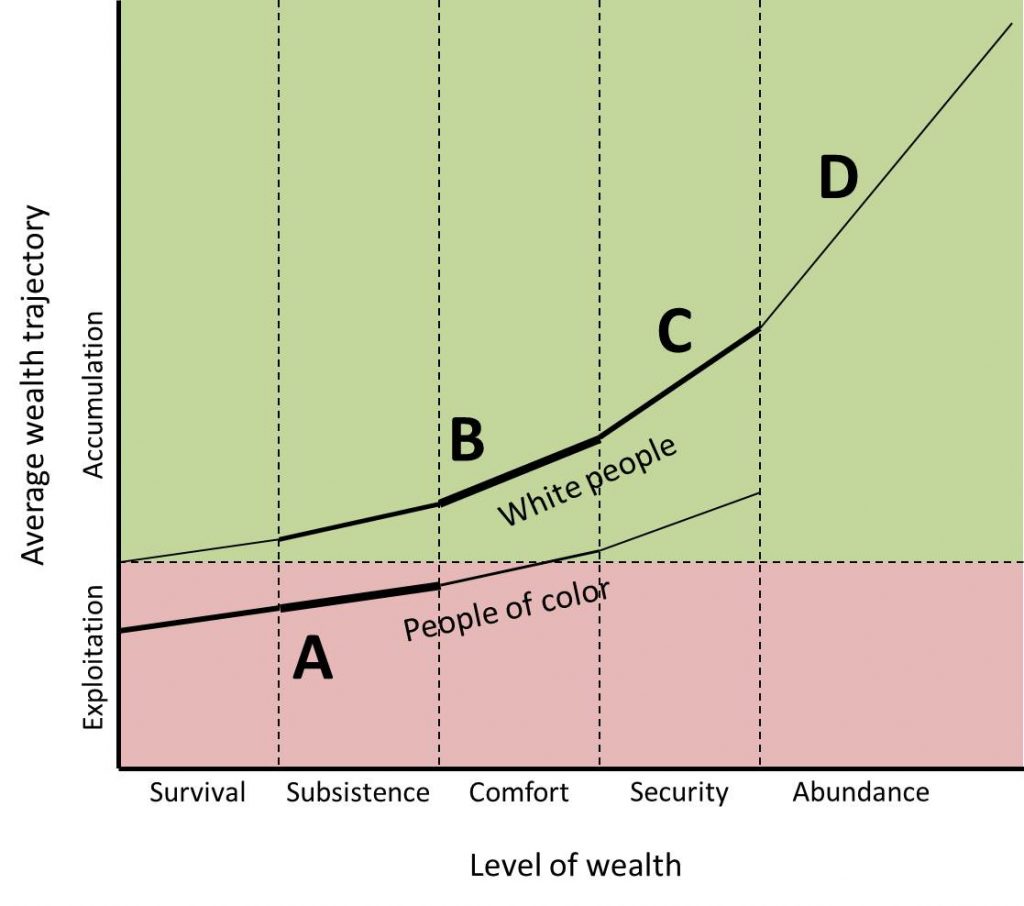
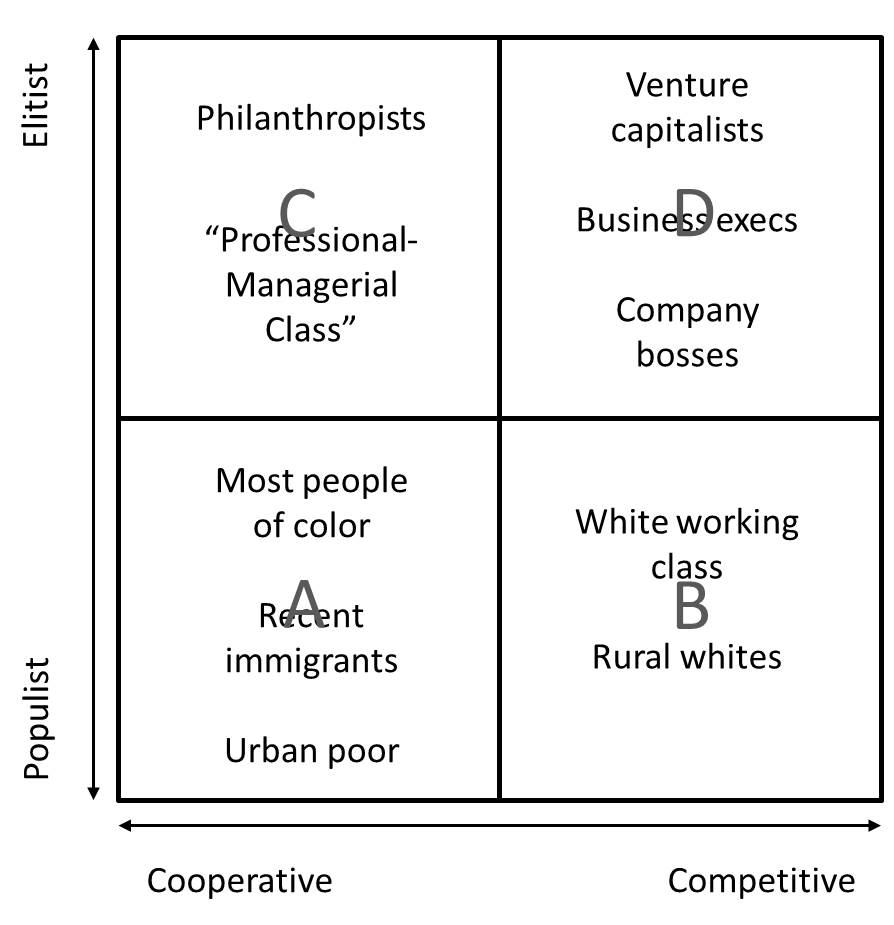
The letters are the four quadrants of American society from last week:
Now, as we will discuss in Part III, economic eras don’t just happen of their own accord. A period of prosperity is not like a period of good weather. A period of prosperity for some is inevitably a period of exploitation for others, and so it is not a coincidence that this was also a period when the United States established itself as a global superpower and brokered deals with governments and elite around the world that led to exploitation on a massive scale. So while a majority of Americans were accumulating wealth, “developing” nations around the world looked like this:
The incredibly damaging and unethical process through which entire nations were converted from largely self-sufficient economies to pools of cheap labor for the global elite is worthy of its own series of posts, but for the purposes of this series it is sufficient to know that it transferred immense wealth to the upper classes of American society, created unsustainable economic growth, and put downward pressure on wages for any industry that could be exported.
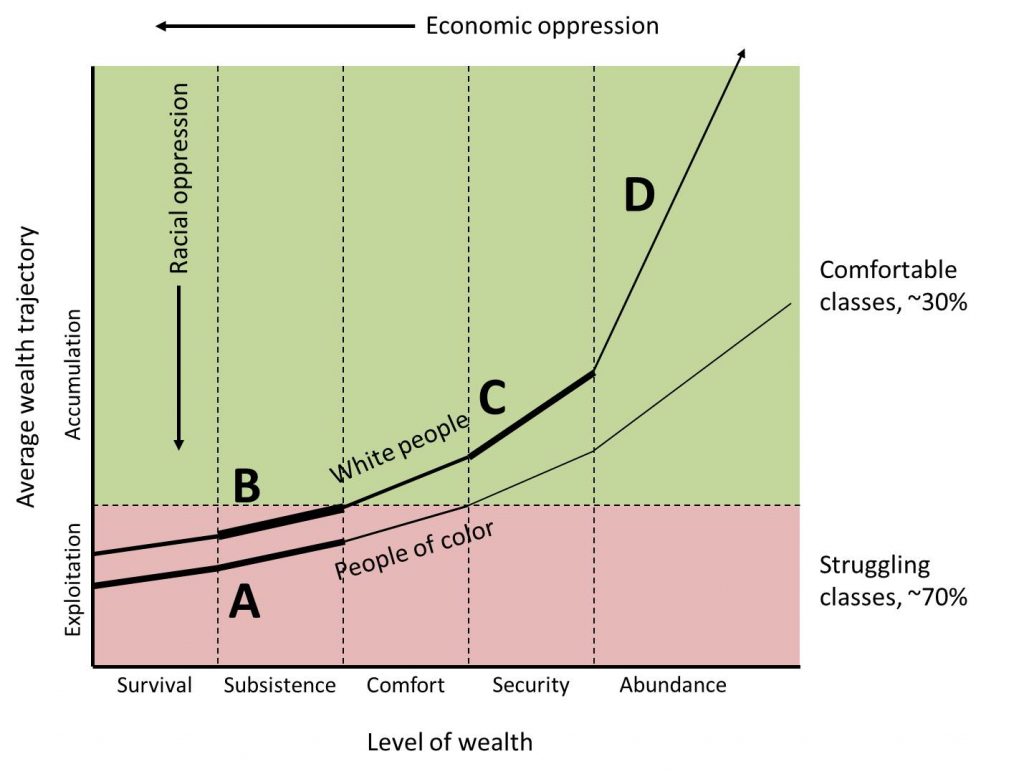
Eventually the global dominance of the United States began to wane as other countries got in on the exploitation game and exploited countries began to rise up and demand fairer terms of trade. At the same time, those at the top continued to demand rates of return in excess of what available wealth could reasonably supply without increasing exploitation. That brings us to today, when the situation in America looks like this:
Compared to forty years ago, the most significant changes are:
- The white working class has fallen into the red zone, due to offshoring of jobs and downward pressure on wages.
- The red zone now encompasses a majority of American citizens.
- The middle class – in the “comfort” zone on the chart – has decreased in relative size.
- Quadrant C – the “professional-managerial class,” has grown in size, wealth, and influence.
- Quadrant D – the wealthiest, now extends off the chart in terms of wealth and wealth trajectory.
Once again, we see an oppressed majority and an elite minority, and we can also separate racial/social oppression (differences in outlook and opportunity unrelated to level of wealth) from purely economic oppression (differences in outlook and opportunity solely dependent on level of wealth).
This chart only captures racial oppression that results in loss of economic opportunity – like housing and hiring discrimination – but not the insults hurled in stores, deaths and beatings by police, and whispered comments and sidelong glances that make racial and cultural minorities into second-class citizens in American society. So we must focus on finally rooting out racism in this time of uprising and solidarity.
At the same time, we need to recognize that at this moment in history, members of the white working class are also second-class citizens. And since the vast majority of people of color are in the working classes, that means that even if we succeed in stomping out racism entirely, in the absence of economic reform these people will still be second-class citizens. Racial and economic reforms are not in competition; they are intersectional and equally essential if we are to attain the equality that we seek.
If we are going to change this curve, it’s worth asking ourselves what it ought to look like. The standard elitist/capitalist argument against economic equality is that enforced equality stifles ambition and fails to reward hard work and entrepreneurship. That is to say, they reject a socialist society that looks like this:
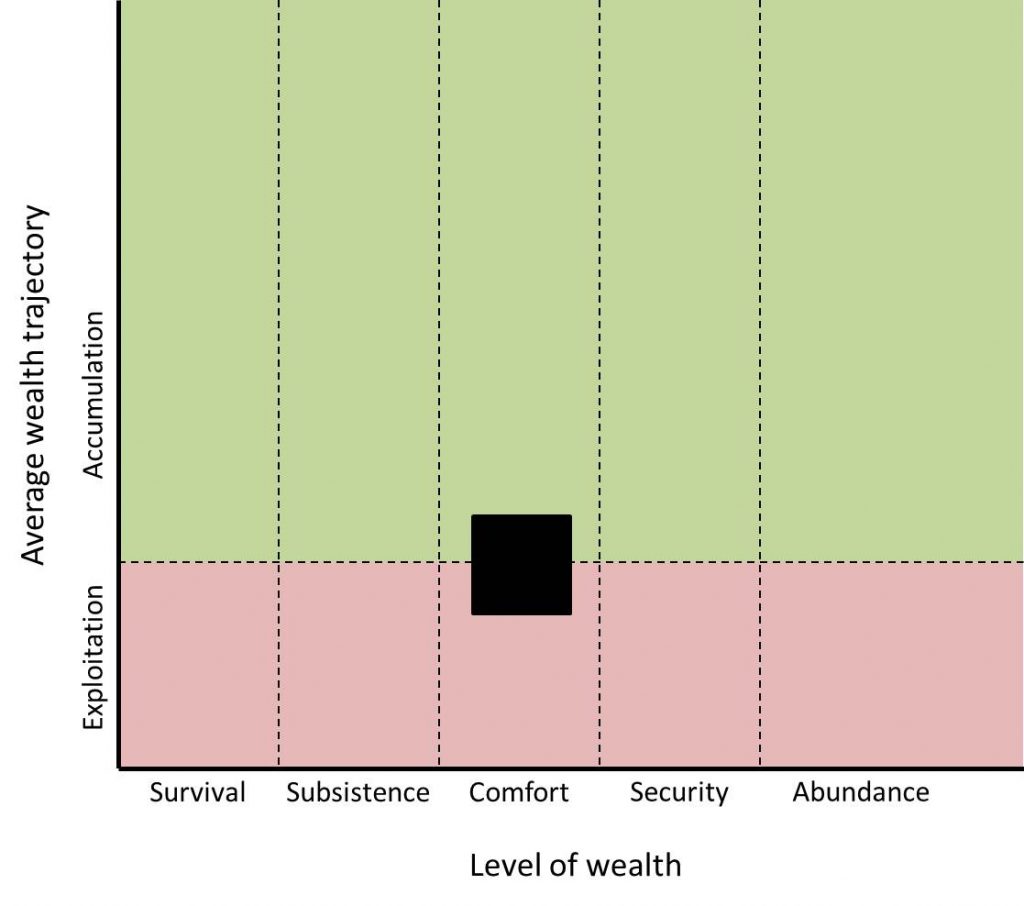
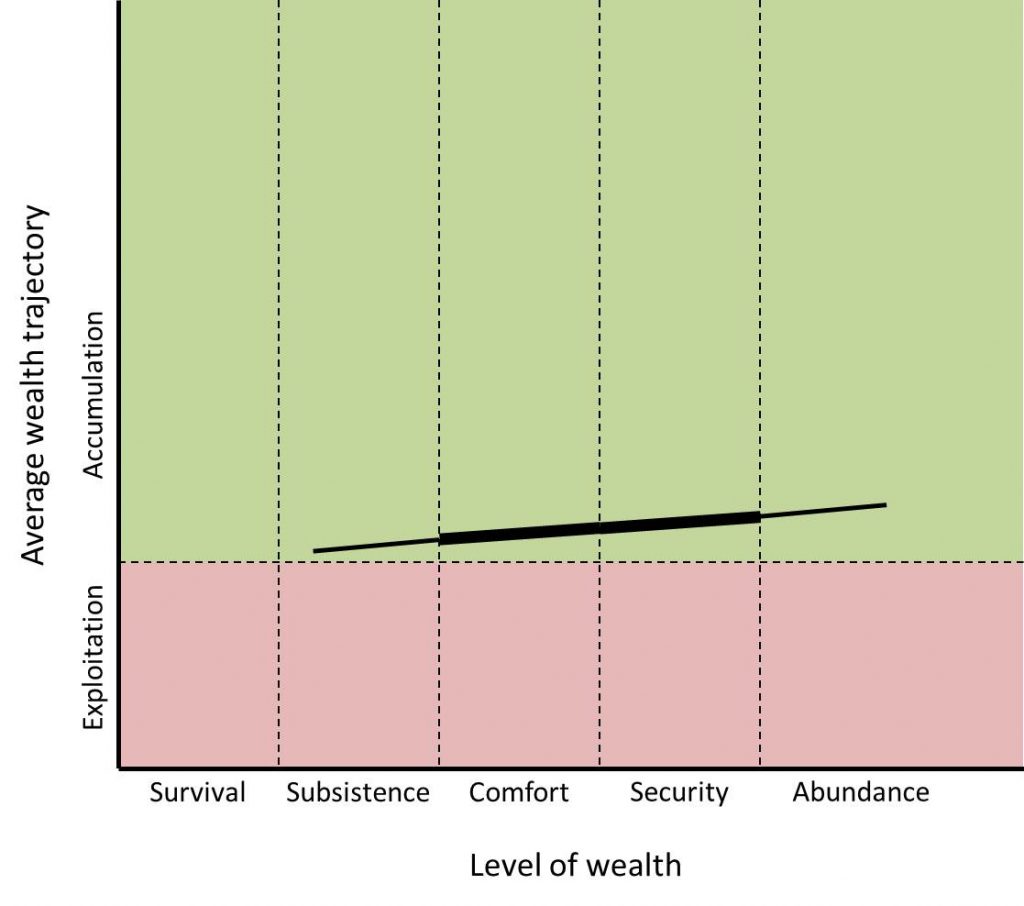
But that is a straw man argument, since no complex society has ever looked like this and very few if any people are proposing such an arrangement. We can continue to reward hard work and ambition while ensuring that basic needs are met for everyone, and we can accept some degree of wealth differential if we can un-stack the deck, ensure that all people have a fair shot, and prevent wealth discrepancies from propagating across generations. In short, we could shoot for a society that looks like this:
To get there, we will need to change the rules of the game. That’s coming in Part IV, but before we get there we need to examine how it is that economic policies and decisions have so far avoided ethical scrutiny. We need to apply the framework of social justice – including implicit bias and structural inequality – to the realm of economics. That will be the focus of Part III: Rehumanizing the Economy.