
I feel called to write during this time; I hope that my perspectives are helpful. Please feel free to share with others.
Where are we at on the curve?
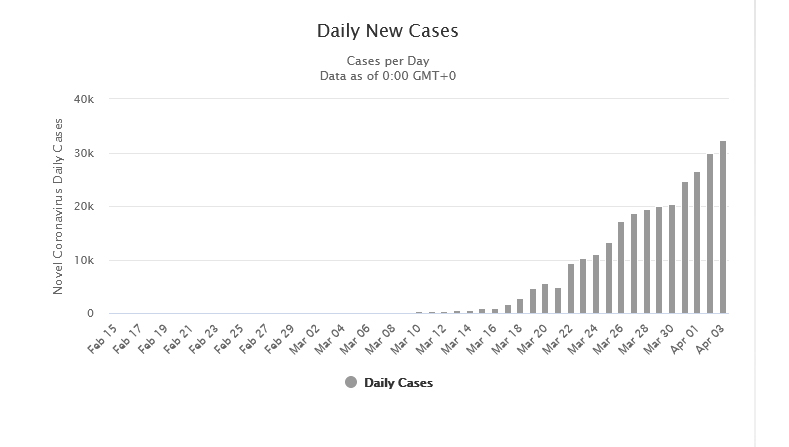
Reported cases of COVID-19 continue to increase in the United States, but on a linear trend rather than an exponential one.
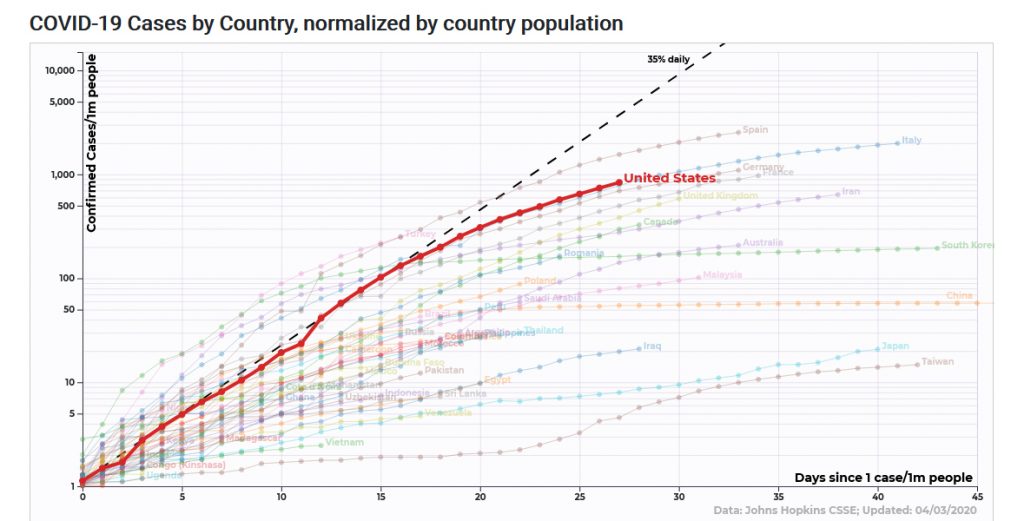
Looking at reported cases normalized to population, we are tracking Italy’s curve very closely, but 14 days behind:
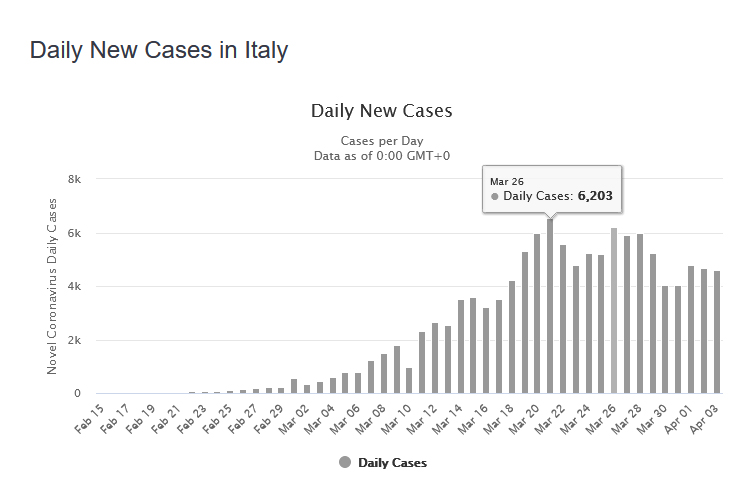
Italy’s graph of daily reported cases looks like this, with a peak 13 days ago and a secondary peak 8 days ago, followed by a slow decline:
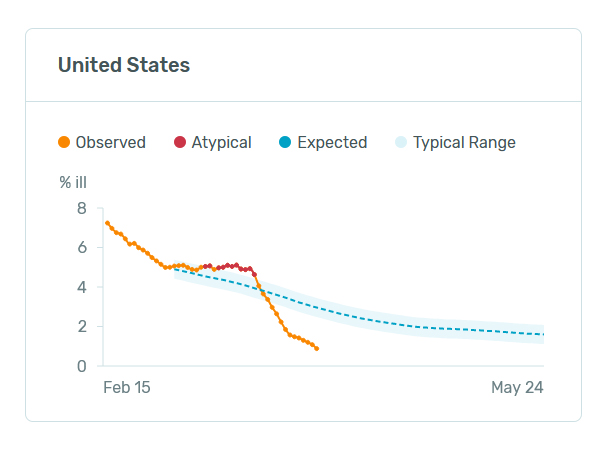
Based on this, I would predict that daily reported cases of COVID-19 in the United States will peak in the next seven days. We shall see if that comes to pass. As added evidence of a positive trend, here is the US fever dataset through April 3. My interpretation would be that the steep decline from March 20-28 mainly represents elimination of the flu through social distancing, while the slower decline since March 28 likely represents a slower decline in COVID-19, which is more contagious and therefore somewhat less responsive to social distancing.
The math is easy, but modeling is impossible
Much has been said about how difficult it is to model COVID-19 progression even a few weeks out. The statistics and modeling site Five Thirty Eight isn’t even trying and is instead posting articles highlighting the insurmountable challenges.
That said, the math behind pandemics is actually quite simple compared to modeling weather, climate, or even the economy. At any point in time there are only two variables that matter: severity and rate of spread. Severity, typically expressed as the Case Fatality Ratio (CFR) is the proportion of infected people who die. Rate of spread is expressed as the reproduction number (R), which is the number of people infected by each infected person. If R is greater than 1, the number of infections is increasing exponentially; if it is less than 1, it is decaying exponentially.
From a modeling perspective, there are problems with both of these parameters. We think the CFR is somewhere between 0.2% and 2%, but we don’t know because we don’t know exactly how many people are infected and experience mild symptoms or no symptoms at all. Widespread random testing could resolve that, but so far that has not been available in most countries including the US. R, on the other hand, is constantly changing. We know what it is with no social distancing, and we know that social distancing lowers it, but we don’t know which actions have which effects. Current case count trends tell us about R as of ~14 days ago, but even this is confounded by the fact that testing is increasing so we may be identifying more cases even as actual case counts decline.
We can build a fairly accurate model with just two parameters (and some nuance that I’m ignoring like hospital capacity), but if we don’t know what either parameter is we can’t build an accurate model. Period. End of story. It does appear however that social distancing has been effective at reducing R to less than 1 in many countries, and if we see a peak in daily new cases in the US in the next week or two, we can conclude that the same is true here.
Social distancing is a 15th century solution
Here is a model showing infection trends following three scenarios: no action (red), weak social distancing (green), and strong social distancing (blue).
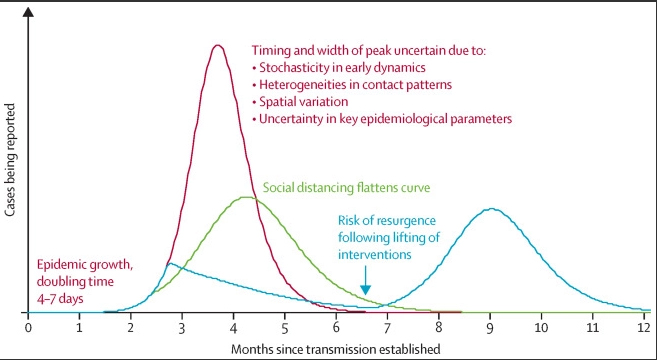
The current debate in the media revolves around whether we are on the green curve – in which case we should be preparing all of our hospitals for triage care – or whether we are on the blue curve. I think it will become clear in the next week or two that the United States, Europe, and much of the world is following the blue curve.
That’s good news, sort of, at the moment, from the perspective of minimizing death and suffering. But not so much once we examine the implications of the chart. Cases peak a few weeks after the start of social distancing, then slowly decline over FOUR MONTHS of the same measures only to rebound when measures are lifted.
Social distancing works. Infectious diseases require human interaction to spread. If we could stop all human interaction for three weeks, the virus would go extinct, but so might we. We need to keep eating, keep growing food, keep tending the sick, and generally not go insane. China pushed social distancing to an extreme that most Americans would never accept, and even then it only worked because the outbreak was mostly limited to one region, and the risk of resurgence will remain from undetected asymptomatic cases or arriving travelers.
Social distancing is what we did when the Black Death traveled around Europe in the Middle Ages, in a time when death from infectious disease was so common that a year of uncontained COVID-19 would hardly have been cause for alarm. It is what many cities did successfully during the Spanish Flu pandemic of 1918-1920. It works, but it is a long and relentless game, and it is incredibly disruptive to our lives.
Captain, your mission is to minimize R!
We’ve been watching Star Trek Picard over the last days – I highly recommend it – and it has left me feeling that we could really use a military-style command center to coordinate our response. If the government is asking its citizens to make wartime-level sacrifices, then we deserve to have a wartime-level response team. Dr. Fauci is wise and experienced, but he ought to be a top advisor rather than the one speaking to the public.
We need a charismatic strategist – the modern equivalent of General George Patton – to gather a team of expert advisers, oversee the response, and communicate the strategy to the public. Rather than political squabbles over anecdotally useful treatments, we need immediate clinical trials with adequate sample sizes and results in a week or two. We need to scale up our testing capacity to 10 million a day or more, in less than two weeks, cutting through red tape and refusing to accept excuses. We need to learn as much as we can about this virus, as quickly as possible. How much do masks help? What proportion of infections result from inhalation vs. surface contact? How many people have already been infected and recovered? How does transmission outdoors compare to indoors? What is essential to know that we haven’t even thought of yet?
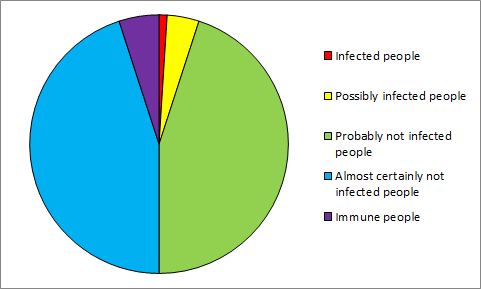
Through testing and tracing we need to convert this pie, in which we are all quarantined suspects
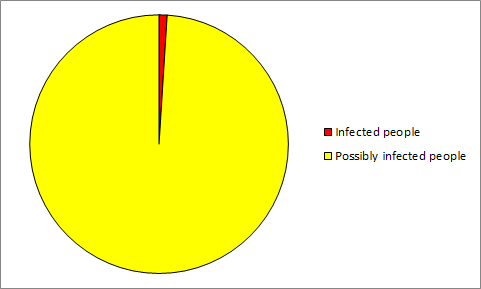
into this one, where most of us are in the clear.
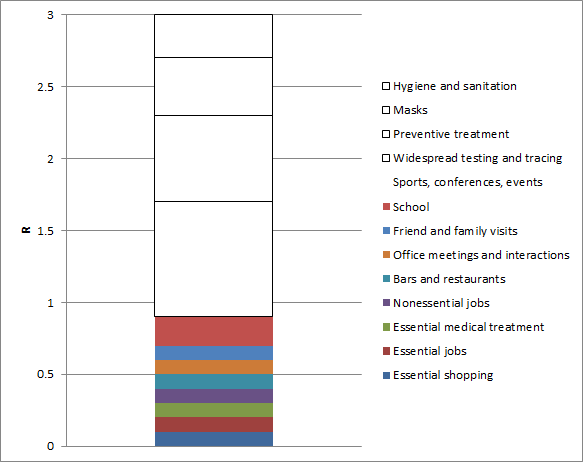
We need to figure out how all of our interactions contribute to R, which would look something like my made-up version here:
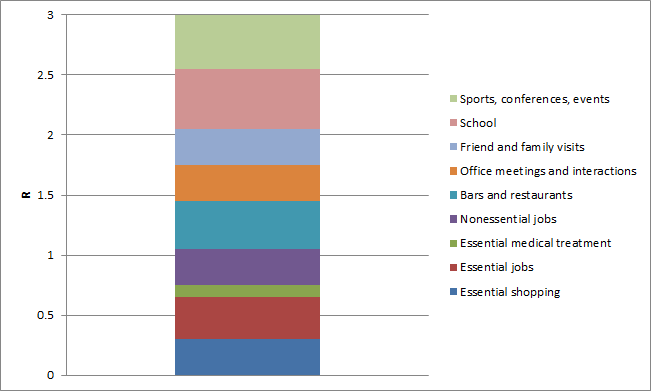
By eliminating entire categories of interactions, we can reduce R to less than 1. That’s why social distancing works.
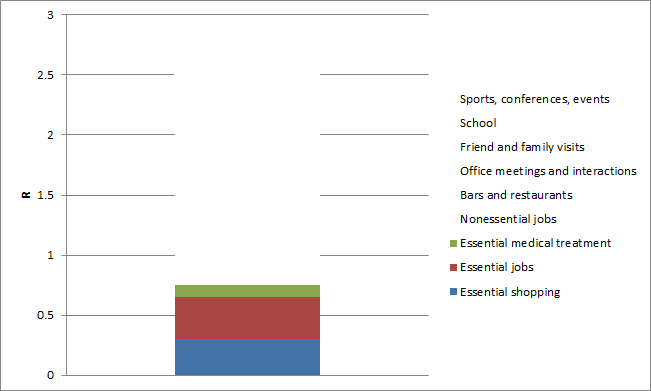
Our captain’s mission – or in the absence of a captain, our flailing society’s mission – is to find alternative ways to reduce R so that we can add back most of the categories of interactions while keeping R below 1. That might look something like this:
Following an initial outbreak and social distancing lockdown, South Korea has succeeded in reopening society while keeping cases low through extensive testing and contact tracing.
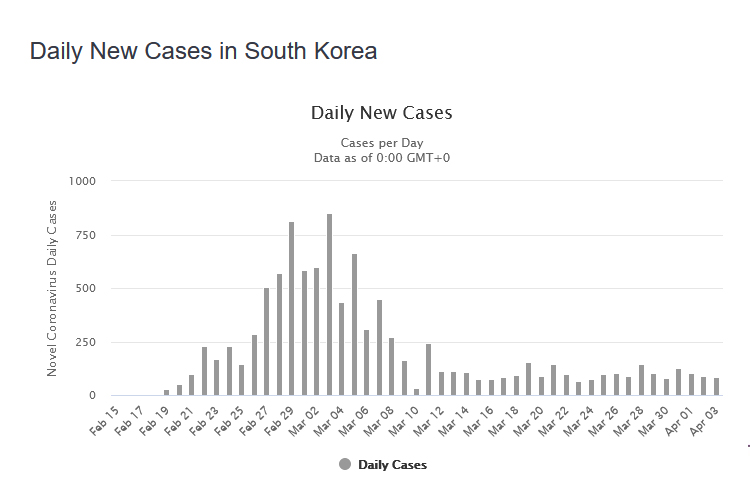
We could do that here as well after another 2-4 weeks of social distancing – depending on the severity of the outbreak in each state or region – but we need to start preparing now.
We need strategy, not just reaction.
We need confident, experienced leadership.
Captain Picard, wherefore art thou?