
It’s been a while since I’ve offered my thoughts on Covid-19, which has receded from the center of our national consciousness even as schools remain closed and infection numbers reach all-time highs.
I am an avid observer. Whether it’s tracking the weather, understanding flows of goods and energy, following planetary conjunctions, or monitoring the progression of a global pandemic. When something is afoot in the world, I watch – sometimes a bit obsessively – to feel like I am being present with the unfolding of reality.
As I have watched this pandemic for the last eleven months, I have been surprised that very few others – in science or in the media – have adopted this approach. Most of the “experts” have assumed that case counts would be immediately responsive to human actions – lockdowns, school closures, masks – and that exponential growth would hold sway until we either drove the much-vaunted R number below 1 or we reached a high level of population immunity. That is not an unreasonable epidemiological assumption, but it needs to be tested against large-scale disease trends over time, and if it fails to adequately describe reality then it is time to consider alternative approaches.
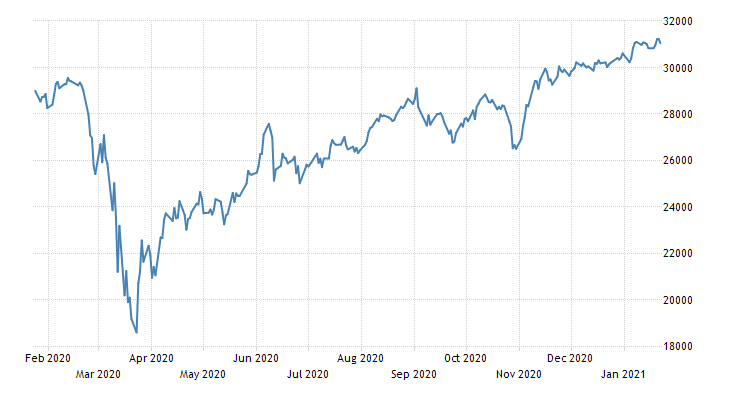
If disease transmission is primarily a function of human behavior and government decisions, we would expect a chart of disease over time to look something like the stock market. Furthermore, we would expect to see vastly different numbers in different states, based on variation in government policies and “non-pharmaceutical interventions” (NPIs) like business closures, mask mandates, etc.
On the other hand, if disease transmission is primarily beyond human control, we would expect a chart of disease over time to follow a smoother pattern – in time with natural oscillations.
Importantly, in this case, the existence of a mechanism of human influence – the fact that a virus spreads from one person to another – does not assert the primacy of this mechanism when examining disease trends across time and space.
With that in mind, let’s examine where we’re at in the Covid-19 pandemic, as of late January 2021.
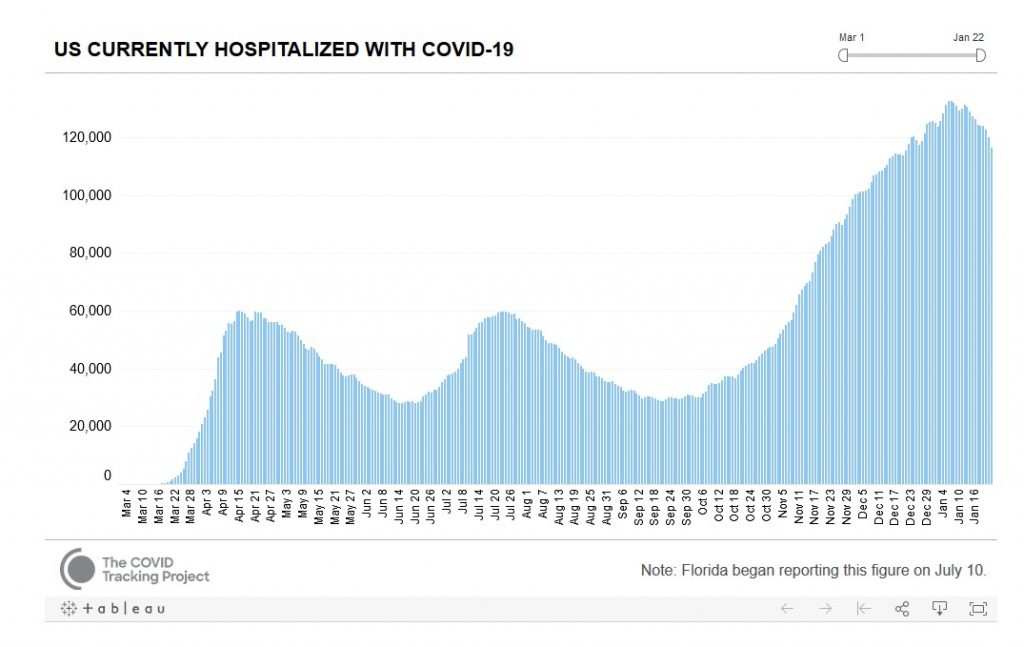
These are nationwide numbers of people in the hospital with Covid-19. Unlike case numbers, which reflect rates of testing, hospitalization numbers reflect the actual number of people sick at any given time. It’s worth noting that these are surprisingly smooth curves, rising and falling on a scale of several months. There are no obvious holiday bumps or reflections of policy changes. Despite a rather intense nationwide lockdown in March, illness continued to climb to a peak in mid April. As economies then reopened in May, cases continued to fall. The decline in illness from August through September does not reflect citizens being more careful than they were in July. The current peak and nascent decline of illness does not reflect people being more careful than in December. I simply don’t see evidence of nationwide large-scale behavioral change that could be driving this. Nor have we yet vaccinated enough people that we should be seeing illness declining for that reason.
As a further illustration of this phenomenon, here are recent hospitalization trends for a few selected populous states:
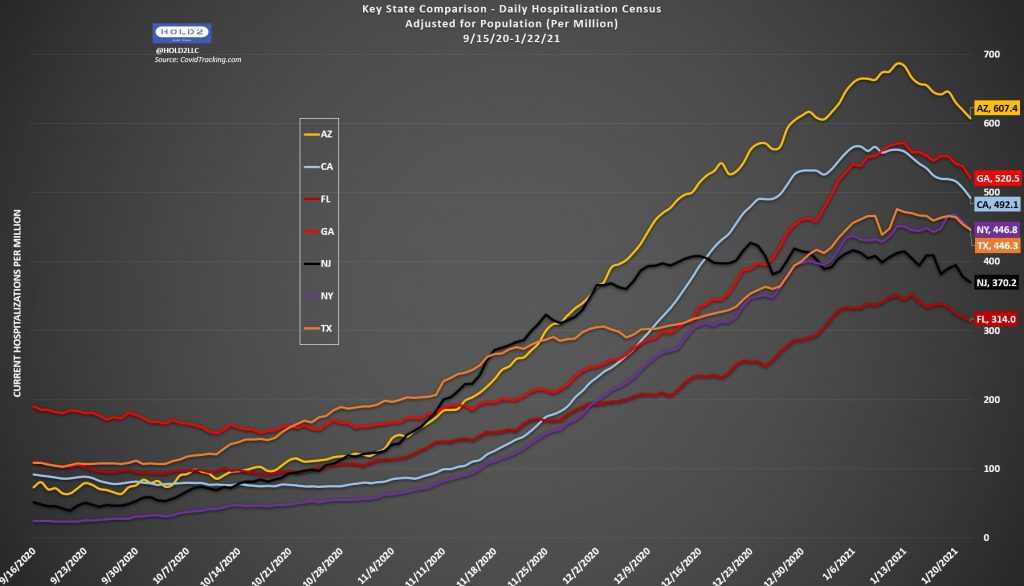
It’s worth noting both that all of these states peak and begin to decline nearly in unison (Upper Midwest states peaked a few weeks earlier), and also that California – with among the strictest NPIs currently in effect – has a higher hospitalization rate than Florida – which has no NPIs at present.
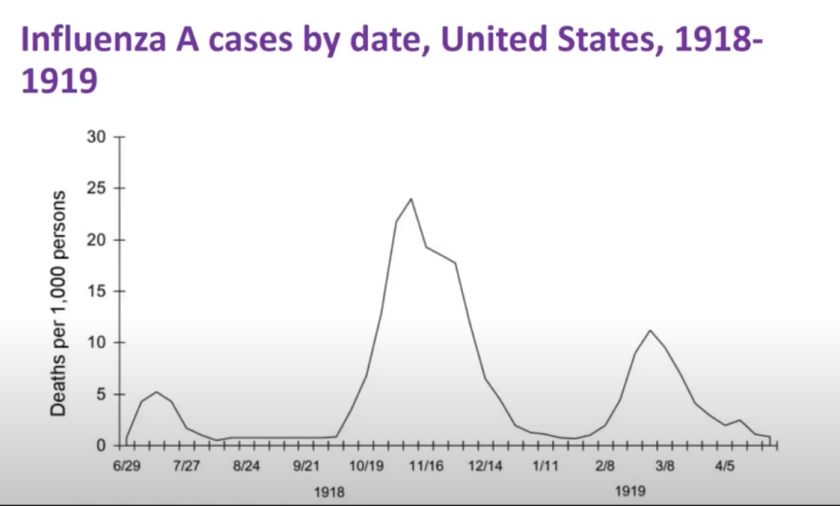
My primary conclusion after eleven months of tracking this pandemic is that we don’t have anywhere near the level of control that we think we have, and some scientists are beginning to notice this as well. If we look at a graph of the 1918-19 flu pandemic, we see very similar waves on very similar timescales.
As to exactly why we don’t have that much control, and what factors are driving these cycles, those are important questions to ask. Perhaps noncompliance and human nature are at fault, or perhaps the virus spreads in ways that cannot be effectively contained while preserving a level of human interaction required for a functioning society. There appears to be a strong seasonal signal – with the most illness in the winter months – and perhaps some other natural oscillations are also involved in ways that we don’t yet understand.
We don’t have to answer those questions, however, in order to begin to apply a historical or observational approach to prediction. We have experienced two smooth waves of Covid-19, rising for 1-2 months and then falling for 2 months. The third and largest wave has now reached a peak following three months of rise and is beginning a clear downward trend across the contiguous US.
I view this as the most significant positive development since the pandemic began – a likely inflection point after which we will probably no longer see days with 200,000 new cases nationwide, or 4,000 daily deaths. I say this for two reasons:
- If, as we have long suspected, there is a seasonal component, we would expect the worst time to occur in the winter, and so – unlike in the April and midsummer peaks – we no longer have reason to believe that a future wave will be more severe.
- Based on antibody tests and other prevalence estimates, it is apparent that many parts of the country are approaching 50% infection – at which point half of the population has developed some level of resistance through exposure. This doesn’t mean that we are “less than halfway there”, however – because those who are now immune tend to be those who are most exposed and who are most likely to expose others – essential workers, delivery drivers, etc. – while those who have avoided infection tend to be those who have been able to carefully isolate. And as population-level disease prevalence declines, it will become easier for those who have been successfully isolating to avoid infection.
Perhaps the somewhat-more-infectious UK strain could change this, but it’s worth noting that – in terms of population level death and infection rates – the UK and US are not that different, and also that cases and hospitalizations have begun to decline in the UK. There is always some risk that a pathogen can mutate to become more virulent or more infectious, but this is historically uncommon on short time scales. Once a pandemic has passed its peak and infected millions or billions globally, it tends to fade away until the next pathogen emerges, or the same bug returns changed and stronger years or decades later.
This is all to say that I have a hopeful Covid outlook at the moment that I have not had since the earliest days, when it seemed that our lockdown might actually lead to effective suppression as in China or New Zealand. I don’t wish to diminish the very real suffering of anyone who has lost a loved one, or suffered a prolonged illness, or is experiencing lasting chronic symptoms with no end in sight. At the same time, I have a strong sense that it will be mostly downhill from here – in the positive bike touring sense of that term. That we will no longer be breaking records in terms of daily new cases or daily deaths in the weeks and months ahead. That we might begin to discover that we can relax our NPIs without returning to an upswing. That this natural peak, perhaps aided by increasing vaccination and a return to warmer weather, will be followed by the gradual return to normalcy that we have all been waiting for.